How to get economy index data from FRED web site
Hello this is data scientist HIROKI. Don’t you have some problem that you want to get economy index data for analyzing but you have no idea how to do it? I also have this type of problem for a half year and I found how to solve it.
This blog is for you who have below problems.
- ・To compare two data(stock data and economy index data) in the same graph
- ・To download economy index data like GDP and FF ratio.
I can explain how to get the stock data from yahoo finance with simple matlab code.
To run this code showed in this article, you need Datafeed Toolbox which is provided with Matlab.
If your PC didn’t install matlab yet, don’t worry. They have 30 day’s free trial for you. and Datafeed toolbox free trial also available.
If you are not good at programming, don’t worry. You can just copy and paste of this blog code.
I’ll explain how to do it step by step from now. Let’s get started!😉
- Install Datafeed Toolbox and Start Matlab software
- Down load program file
- Run
1. Install Datafeed Toolbox and Start Matlab software
At first, you need install Datafeed Toolbox on your PC.
Then, you need start Matlab software.
If you didn’t install matlab on your PC yet, you can access this page for download 30 day’s free trial Matlab. Then please install Datafeed Toolbox on your PC.😉
2. Copy and paste below code
Please create new matlab script on the directory and copy below code and paste it on the file.

%this is imput  parametor. you can change the series and date whatever you want.
series = 'GDPC1'; %GDP delta=4
start_date = '10/24/1950'; %mm/dd/yyy beginning of date range for historical data
end_date = '10/24/2021'; %mm/dd/yyy ending of date range for historical data


%getting economy index data from fredwebsite and store the data to the fredData parametor.(just copy and paste)
fredData = get_fred_data(start_date, end_date, series);


%below code is the function which you can get economy index data from fredwebsite(just copy and paste)
function fredData = get_fred_data(startdate, enddate, series)
url = 'https://fred.stlouisfed.org/';
c = fred(url);
d = fetch(c,series);
d.Data(1:3,:);
format bank
d = fetch(c,series,startdate,enddate);
forex = d.Data(:,2);
maxforex = max(forex);
value = abs(forex-maxforex);
idx = find(value<0.001,1);
date = d.Data(idx,1);
datestr(date);

close(c)

t=datetime(d.Data(:,1),'ConvertFrom','datenum');
data1=d.Data(:,2);
fredData = timetable(t,data1);
end
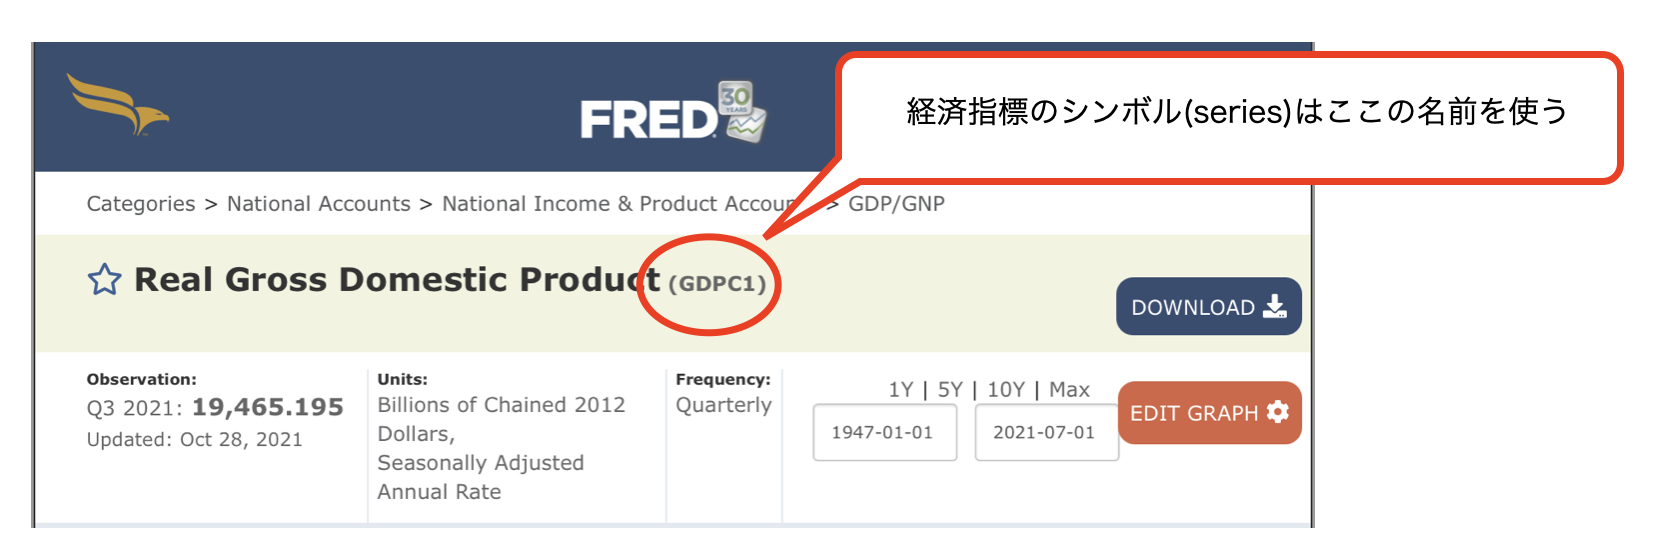
Just in case, the economy symbol should be used as the same one as shown below red point on the FRED web site.

3. Run
pls push the run button as shown below. Then
You can get GDP data from Oct 24th 1950 to Oct 24th 2021(just as an example)😀

Example
As an example I can show you the code which give you S&P500 data and GDP data comparison in the same graph. Before running this code, please download this program which you can access the yahoo finance data with. And save the same directory of below matlab file.
Copy below code and paste it and run. Then you can get the graph showing S&P500 and GDP🙂
%Getting GDP data from Oct 24th 2011 to Oct 24th 2021 from FRED web site
fredData = get_fred_data('10/24/1950', '10/24/2021', 'GDPC1');

%Getting S&P500 data from Oct 24th 2011 to Oct 24th 2021 from YahooFinance
stockData = hist_stock_data('24101950','24102021','^GSPC');

% Createing graph
yyaxis left
plot(stockData.Date,stockData.Close)
ylabel('S&P500 [USD]')
hold on
yyaxis right
plot(fredData.t,fredData.data1)
legend('S&P500','GDP')
title('graph of S&P500 and GDP')
xlabel('Year')
ylabel('GDP')

% % If you want to change the range of x axis, pls delete below comment out
% str = ["2005-10-24","2021-10-24"];
% xlim(datetime(str))


%below code is the function which you can get economy index data from fredwebsite(just copy and paste)
function fredData = get_fred_data(startdate, enddate, series)
url = 'https://fred.stlouisfed.org/';
c = fred(url);
d = fetch(c,series);
d.Data(1:3,:);
format bank
d = fetch(c,series,startdate,enddate);
forex = d.Data(:,2);
maxforex = max(forex);
value = abs(forex-maxforex);
idx = find(value<0.001,1);
date = d.Data(idx,1);
datestr(date);
close(c)
t=datetime(d.Data(:,1),'ConvertFrom','datenum');
data1=d.Data(:,2);
fredData = timetable(t,data1);
end
If you want to change the range of x axis, please delete the comment out ‘%’ in the middle of the code as shown below in order to enable below code.
str = ["2005-10-24","2021-10-24"];
xlim(datetime(str))
You’ll be able to get below graph.
Next blog
I’ll explain how to analyze stock time line data.💹
Thank you for reading. Hiroki🐶